Dashboard
The dashboard at /dashboard is the first thing you see after signing in. It gives a quick read on what your organization has been doing — high-level stats and your most recent calls — so you can jump straight to whatever needs attention instead of hunting through menus.
What's on the page
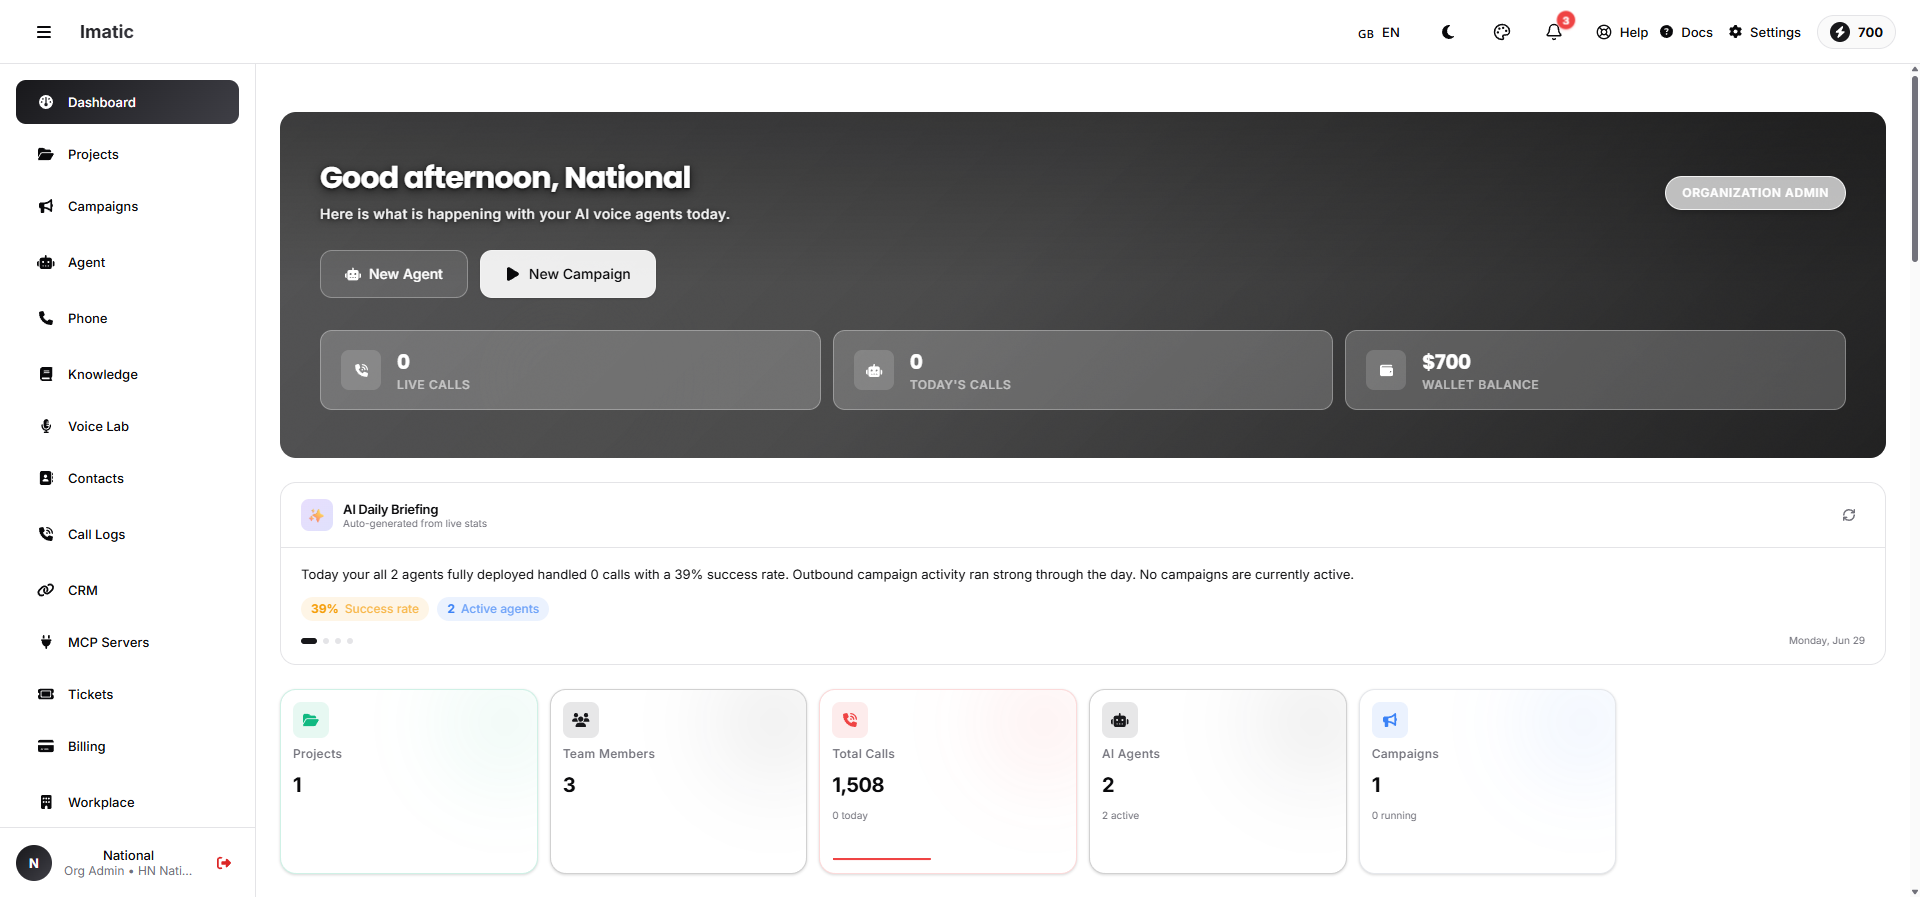 The dashboard: live and today’s calls, wallet balance, the AI daily briefing, insights and call-volume charts.
The dashboard is an activity overview for your organization. It pulls together the signals that tell you, in a few seconds, whether things are running normally:
-
Activity stats — a row of metric cards summarizing your calling activity at a glance. Every role sees:
- Total Calls — all calls placed and received, with a "N today" subtitle, a trend indicator and a 7-day sparkline.
- AI Agents — how many voice agents exist, with the number currently active.
- Campaigns — how many campaigns exist, with the number currently running.
Higher-privilege roles see extra cards first: a super_admin also gets Organizations, Projects and Total Users; an org_admin also gets Projects and Team Members. Each card is clickable and jumps straight to its area.
-
Recent calls — a live activity feed of the latest calls your agents handled. Each row shows whether it was an inbound or outbound call, which agent took it, how long ago it happened, and a status dot (success, warning or error) so you can spot failures or odd outcomes immediately. A View All link opens the full call logs.
Around these you'll also find a greeting banner (with today's calls, live calls and wallet balance), an AI daily-briefing summary, charts (daily call volume, cost breakdown, success rate, inbound vs. outbound), an agent leaderboard, and a wallet/usage panel — all drawn from the same organization data.
Everything here reflects your organization's data. What you see is shaped by your role and project assignments: an org_admin sees the whole organization, while a project_manager or normal_user sees the work in the projects they're assigned to.
Use it as your daily check
Treat the dashboard as a launch pad, not a destination. A quick routine each day keeps surprises from piling up:
- Scan the stats to confirm activity is roughly where you expect it — not unexpectedly quiet (something stalled) or unexpectedly high (a campaign running away).
- Skim recent calls for outcomes that look wrong — failures, very short calls, or unexpected statuses.
- Drill in wherever something looks off, using the links below.
If a recent call looks off, open it in Call logs to hear the recording and read the transcript and AI summary — the fastest way to understand what an agent actually said.
Where to go next
From the dashboard you'll typically move into one of these areas:
- Campaigns — start, pause or check an outbound campaign in its live console.
- Call logs & analytics — open any call for its recording, transcript, AI summary and sentiment.
- Contacts — manage leads, callbacks and bulk uploads.
- Agents overview — build or tune an AI voice agent.