Responses
Responses is where you read what people said. Open it from a form card or at /responses?form=id, pick a form, and switch between a high-level summary, an individual-response navigator, and a detailed table. Everything here is scoped to your own forms.
 The Summary tab turns every question into a chart, with key metrics across the top.
Pick a form
A form picker at the top lets you choose which form's responses you're looking at. Switch forms without leaving the page.
If a form has no responses yet, you'll see an empty state with a prompt to share it — a quick way back to your share link.
Metrics
A strip of metric tiles sits above the tabs:
- Total responses — how many you've collected.
- Last 7 days — responses in the past week.
- Latest — when the most recent response arrived.
- Avg score (scored forms) or Questions — the average score for scored forms, otherwise the question count.
A filter bar lets you narrow everything below to a subset of responses so you can compare segments.
Summary tab
The Summary tab gives you the shape of your results at a glance:
- Per-question charts — each question summarized visually, with bar charts for choice questions and stats for the rest.
- Word-frequency cloud — for open-ended text questions, the most common words are shown sized by how often they appear, so themes jump out without reading every answer.
This is the fastest way to answer "what are people saying overall?"
Individual tab
The Individual tab is a one-response navigator: it shows a single submission at a time with every answer it contains, and Newer / Older controls to step through responses one by one. Use it to read submissions in full, the way the respondent filled them in.
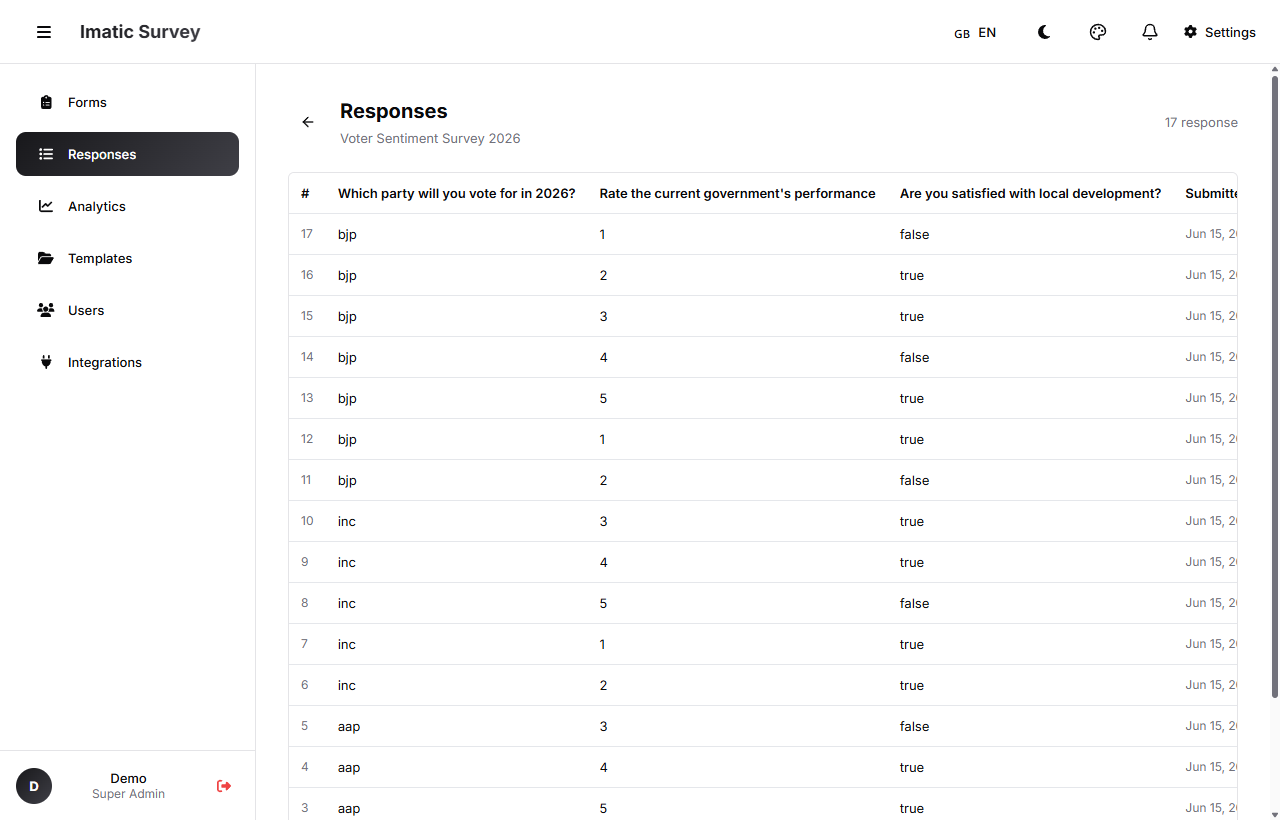
Table tab
The Table tab is for working with responses as rows:
- Per-field columns — every field becomes a column, with one response per row.
- Search — find responses containing specific text.
- Sort — order rows by any column.
- Paginate — move through large response sets page by page.
Use the Table when you need to scan, search, or sort across all submissions at once.
Export
Export isn't a tab — it's a download button at the top of the page. Open it and pick a format:
- CSV (.csv) — for spreadsheets and data tools.
- Excel (.xlsx) — an Excel workbook.
- Print / Save as PDF — a print-friendly view you can print or save to PDF for reports and records.
Reach for the Summary tab to understand patterns, the Table tab to search and sort across submissions, and the Individual tab to read a single response in full.