Analytics
Analytics is the deeper companion to Responses. Where the response summary tells you what people said, analytics helps you see how answers relate to each other. Open it from a form card or at /analytics?form=id. It has two views: Distributions and Cross-tab / Pivot.
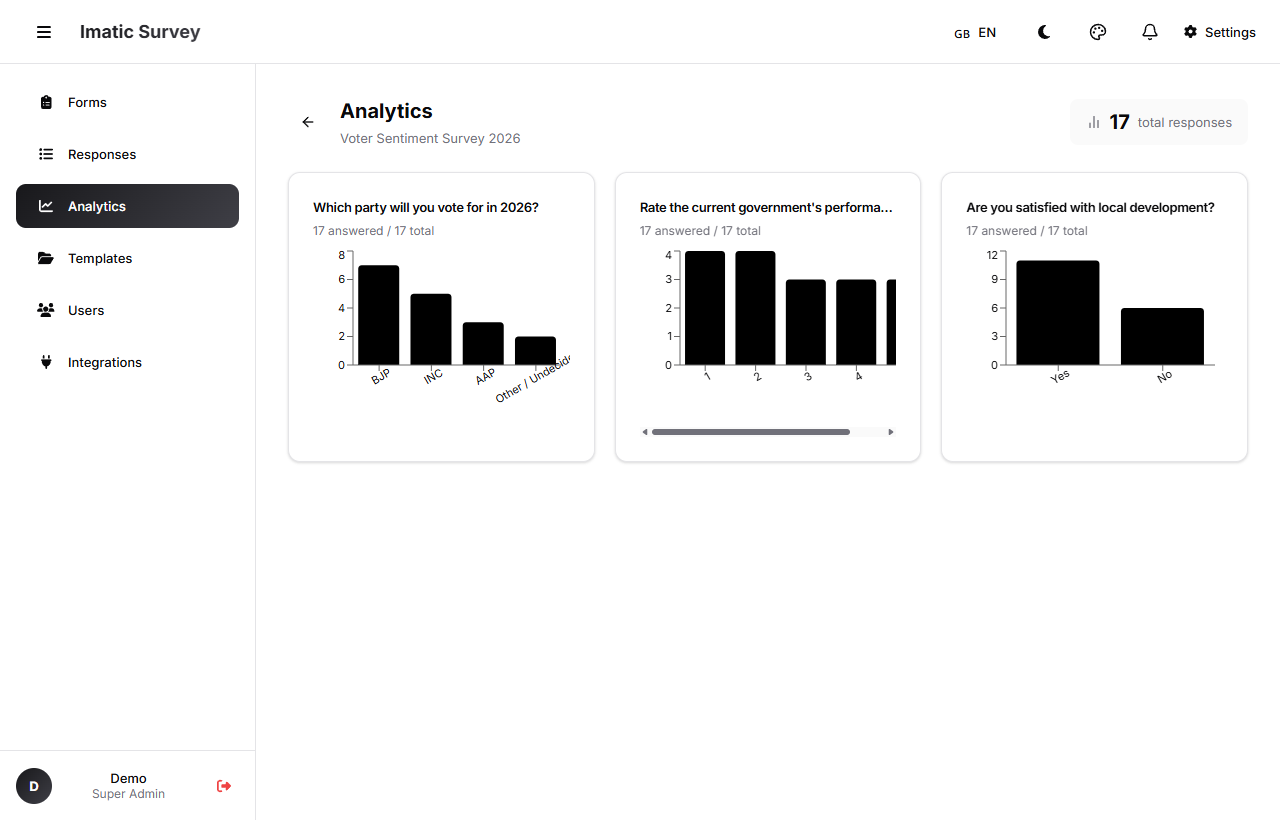 Analytics breaks results down by question and by cross-tab.
Pick a form
Use the form picker at the top to choose which form to analyze, and switch between forms without leaving the page.
Distribution
Distribution charts show how answers are spread for each question — the share of respondents who chose each option, the spread of ratings, and so on. It's the clearest view of "what's the most common answer here?"
Cross-tab
Cross-tab builds a two-dimensional pivot: pick one question for the rows and another for the columns, and see how answers to one break down against answers to the other. For example, cross-tab satisfaction against region to see which areas are happiest. This is where you find relationships a single-question chart can't show.
The Analytics dashboard loads its data when you open it. Reload the page (or reselect the form) to pull in the latest responses.
Public live results
For polls, you can share a public live results page at /r/:code. Anyone with the link sees the tallies update live — the page auto-refreshes every few seconds — perfect for showing a room or an audience the results as votes land, without giving them access to your account or raw data.